Insight Reports are the primary reporting tool in FetchEH. Reports are built using a Filter that produces matching results for the Report. Results can be exported, printed and can include Field Statistics to further understand Results.
Reports can be setup for operational workflows, MPR reporting or designed to better understand a specific aspect of a workflow or data.
Creating a Report #
This section will walk through the steps used to create a new Report.
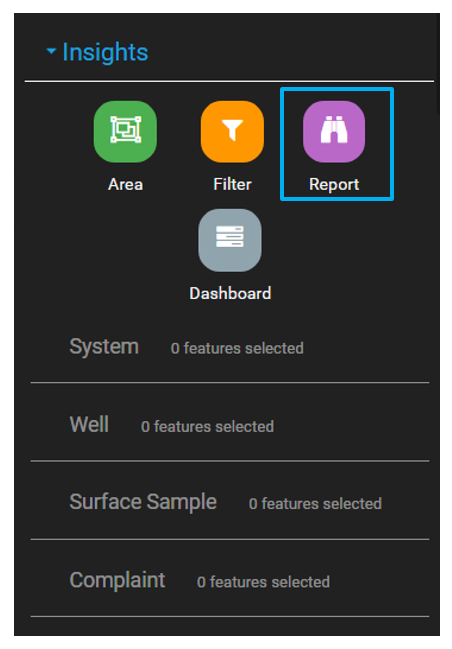
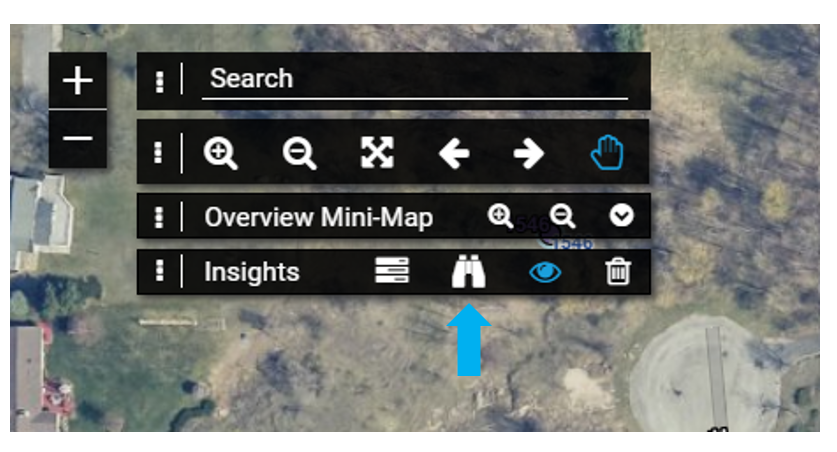
Use the Main Menu to select the Insights button.

Select the Report option from the Insights menu to create a new Report.
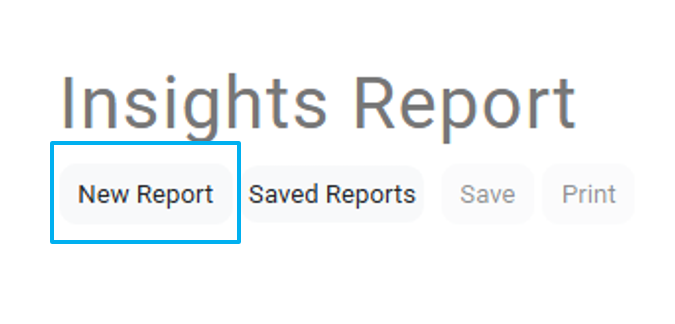
Click the New Report button.
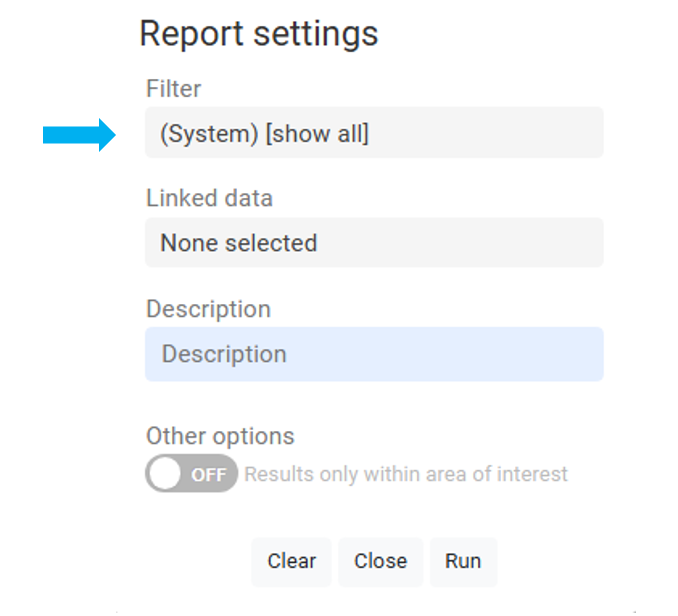
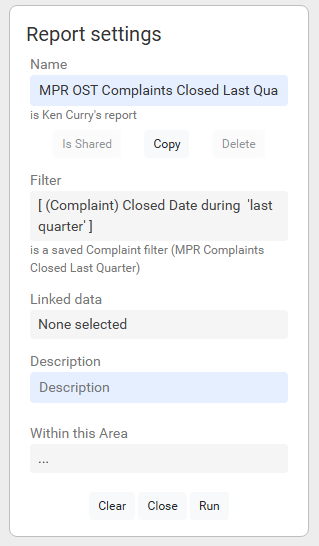
From the Report settings modal, select or create a new Filter.
For help with Filters, read this article.
Under Linked Data, select the tables that will be included in the Report. Selecting a table, such as the Inspection table, will add all of the Inspection Fields to the Report.
Reports may only require one table, so there may not always be a need to add all tables to your Reports. For example, if your Report is looking for all Inspections in Q4, you may only be interested in the Inspection table as that table will contain Inspection Purpose and Inspection Date. However, if you also want to understand the Violations that were cited during Q4 Inspections, you would also include the Violations table in your Report.
To use the option “Results only within area of interest”, you must first have selected an area of interest. See this article (coming soon).
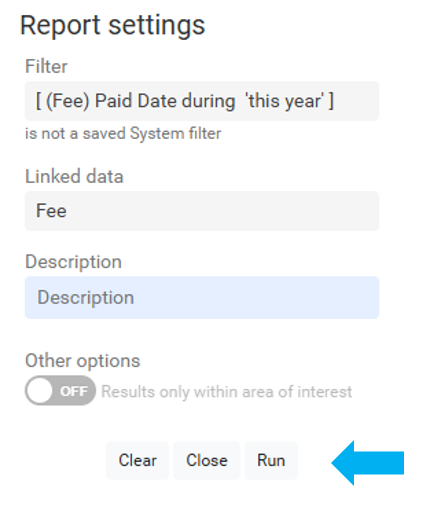
Select Run to execute the Report.
Understanding the Report Interface #
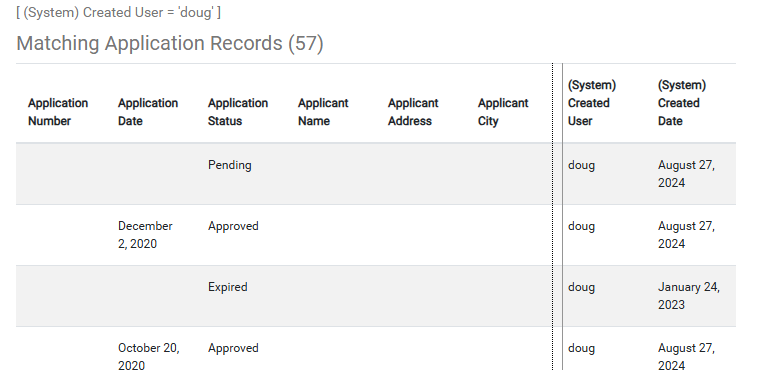
The Report will display the Report Title and description at the top.
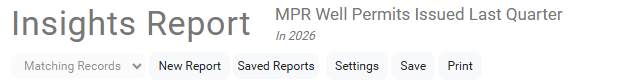
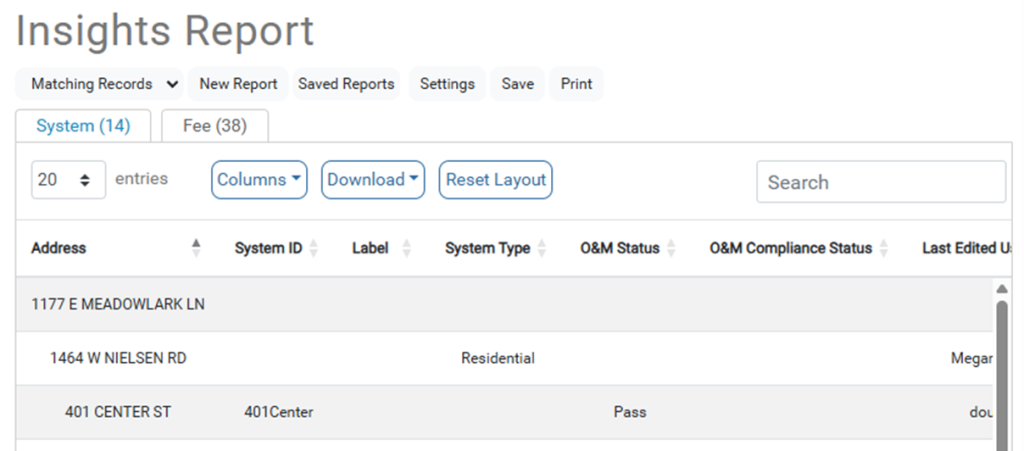
There will be tabs matching the original Layer and any Linked Data that was chosen.
To view the respective data, click the tab for that layer.
Clicking an individual record in the report will open a new it as a form and FetchEH will attempt to locate the record in the map.
To quickly return to a report after looking at an individual record, click the Report button on the Insights toolbar.
The data returned in the report can be searched by entering a term in the search box.

Columns: select what columns (fields) are visible or not visible in the results window. Note that you can add parent fields to Linked Data Columns. In the Columns for Inspection for example, scroll down until you see the parent fields, which are prefixed with (Facility) to note that they are not an Inspection field.
* Be sure to Save the Report again to retain the layout changes – this will remove the need to re-create the Column layout each time you run the Report.
Download: download the results to a CSV file. Select Visible Columns to only export the visible Columns, or select All Columns to download all Columns in the corresponding data.
*There is also an option only available on Fees called Grouped for Invoice, which attempts to create an output aggregating Fees that belong to the same parent record.
Reset Layout: returns the Column layout to the default setting.
Move a Column by holding down the mouse key over the Column name and then drag it to a new position.
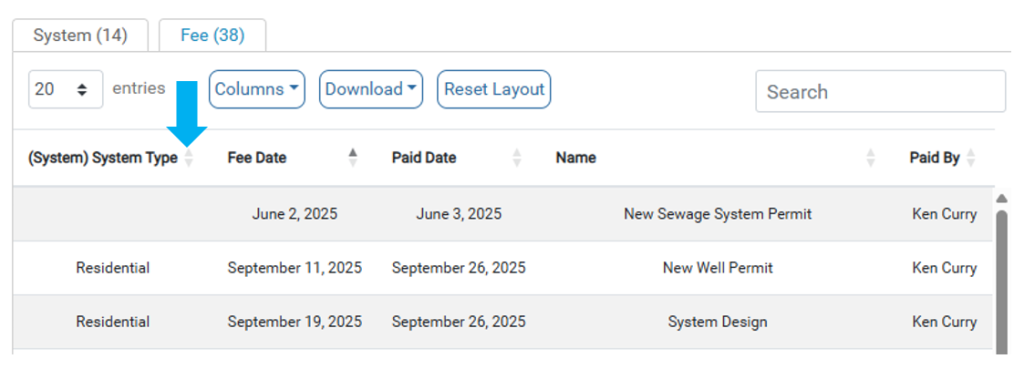
Each Column can also be sorted using the grey arrows to the right of the Column name.
Saving & Editing a Saved Report #
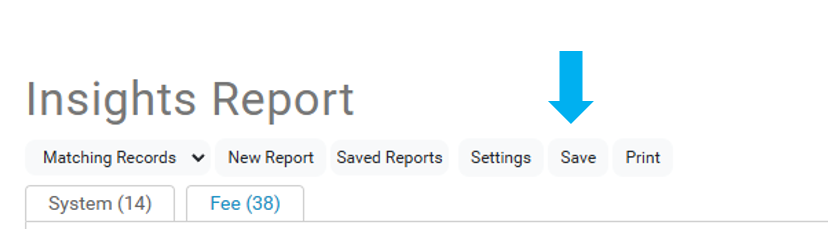
After saving and naming the report, there are new options for that report.
Clicking the Settings Button on a saved Report allows the user to readjust the filter or Linked data, but also whether the Report is:
- Private
- Viewable only by the user who created the report
- Public
- Usable by any user of the map
- But they will not have editing privileges
Reports can be temporarily modified, but those changes can only be saved by the person who created the Report.
Creating a copy of a Report gives a new user the ability to change and save the Report to meet their specific needs.
Within this Area #
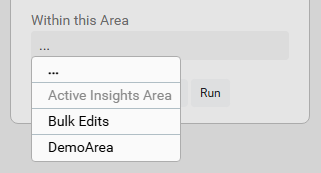
Use a defined Area of Interest to filter the Report data. Any saved Area of Interest can be used, or the special Active Insights Area option which uses the current Visual Insights Area. Any value beside Active Insights Area will be saved with the Report. See this article.
Matching Records / Available Actions #
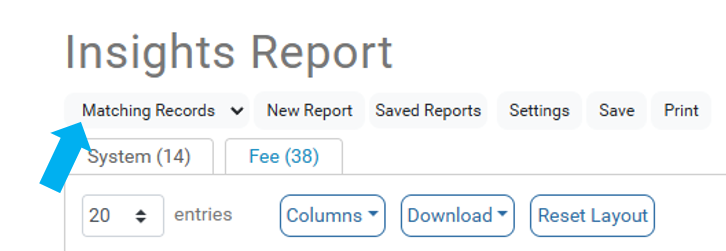
Click the Matching Records button opens a dropdown which provides the option to enter the Insights Report Actions area. To read more about what can be done here, read this article (coming soon).
Printing #
Select Print on the Report menu to generate output.
Fine tune the layout of the Report by modifying the Column size. Hold the mouse key down over a Column border and drag it to modify the size.