FetchGIS Help


Map Basics

This section covers options for Navigating the map, using Information Windows, managing the visibility of Map Layers and an overview of the Main Menu Bar options.

Important: Map Layers, such as parcels, are displayed based on zoom level. This is often referred to Level of Detail (LOD) and means that a Map Layer may not be visible until the map display is sufficiently zoomed in.

Map Navigation

Map Navigation is the process of changing the map scale or location by Zooming In/Out or Panning the map display. Map navigation is conducted by navigation tools located on the Navigation Toolbar, overview mini-map, incremental zoom buttons, or by using the mouse, touchpad, or touchscreen display. Note: Due to screen size constraints, the Navigation Toolbar and overview mini-map are not available on phones.

The mouse scroll wheel can be used to Zoom In or Zoom Out as described below, or equivalently pinch zooming on touchpads and touchscreens. A double click/tap on the map display will also Zoom In one level, but only when the Pan tool is active.

Zoom - To zoom in, move the mouse scroll wheel up (towards the top of the mouse). To zoom out, move the mouse scroll wheel down (towards the bottom of the mouse). Alternately, touchpads/touchscreens can zoom in by moving two fingers apart, or zoom out by moving two fingers together.

Viewing Information Windows to access parcel information:

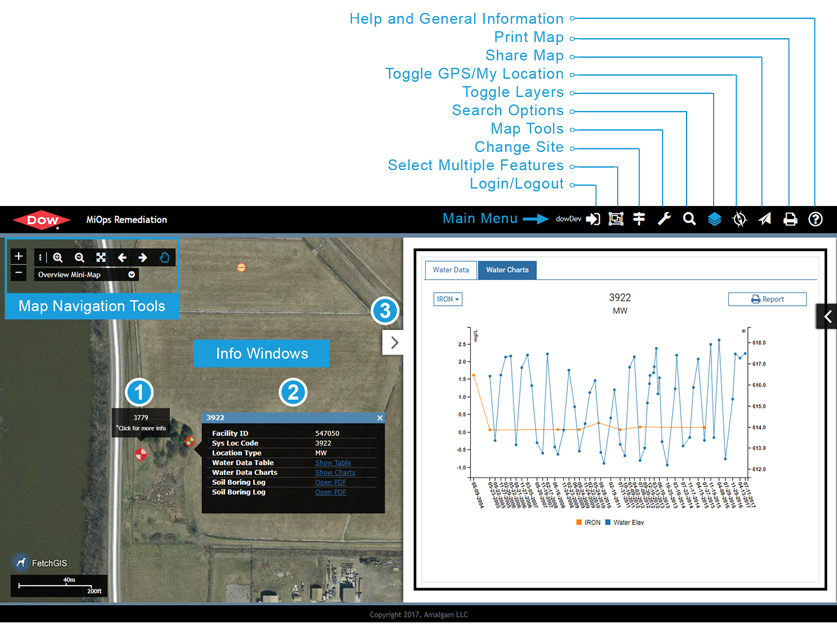
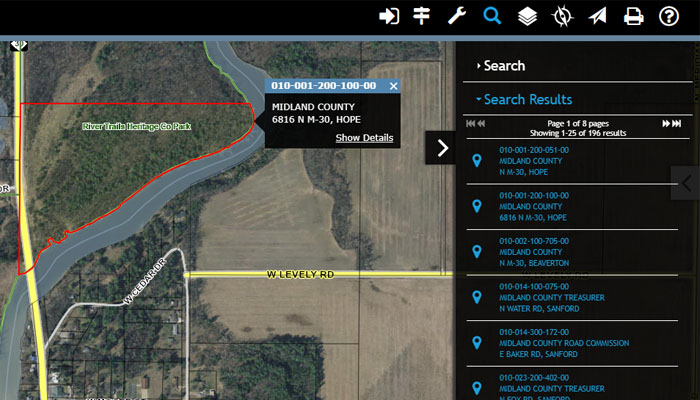
  1. Move the cursor over a parcel to view an Information Window containing the Parcel Number and an option to ‘Click for more info’ (see the number one (1) in the FetchGIS Workspace image).

  2. Selecting ‘Click for more info’ opens another Information Window containing additional parcel information, such as the Owner Name and Address, along with the option to ‘Show Details’ (see the number two (2) in the FetchGIS Workspace image).

  3. Selecting ‘Show Details’ opens the Land Information Pane to display parcel record details for the selected parcel. The Land Information Pane provides the option to create a Parcel Report that includes a map of the parcel and the parcel record details (see the number three (3) in the FetchGIS Workspace image).
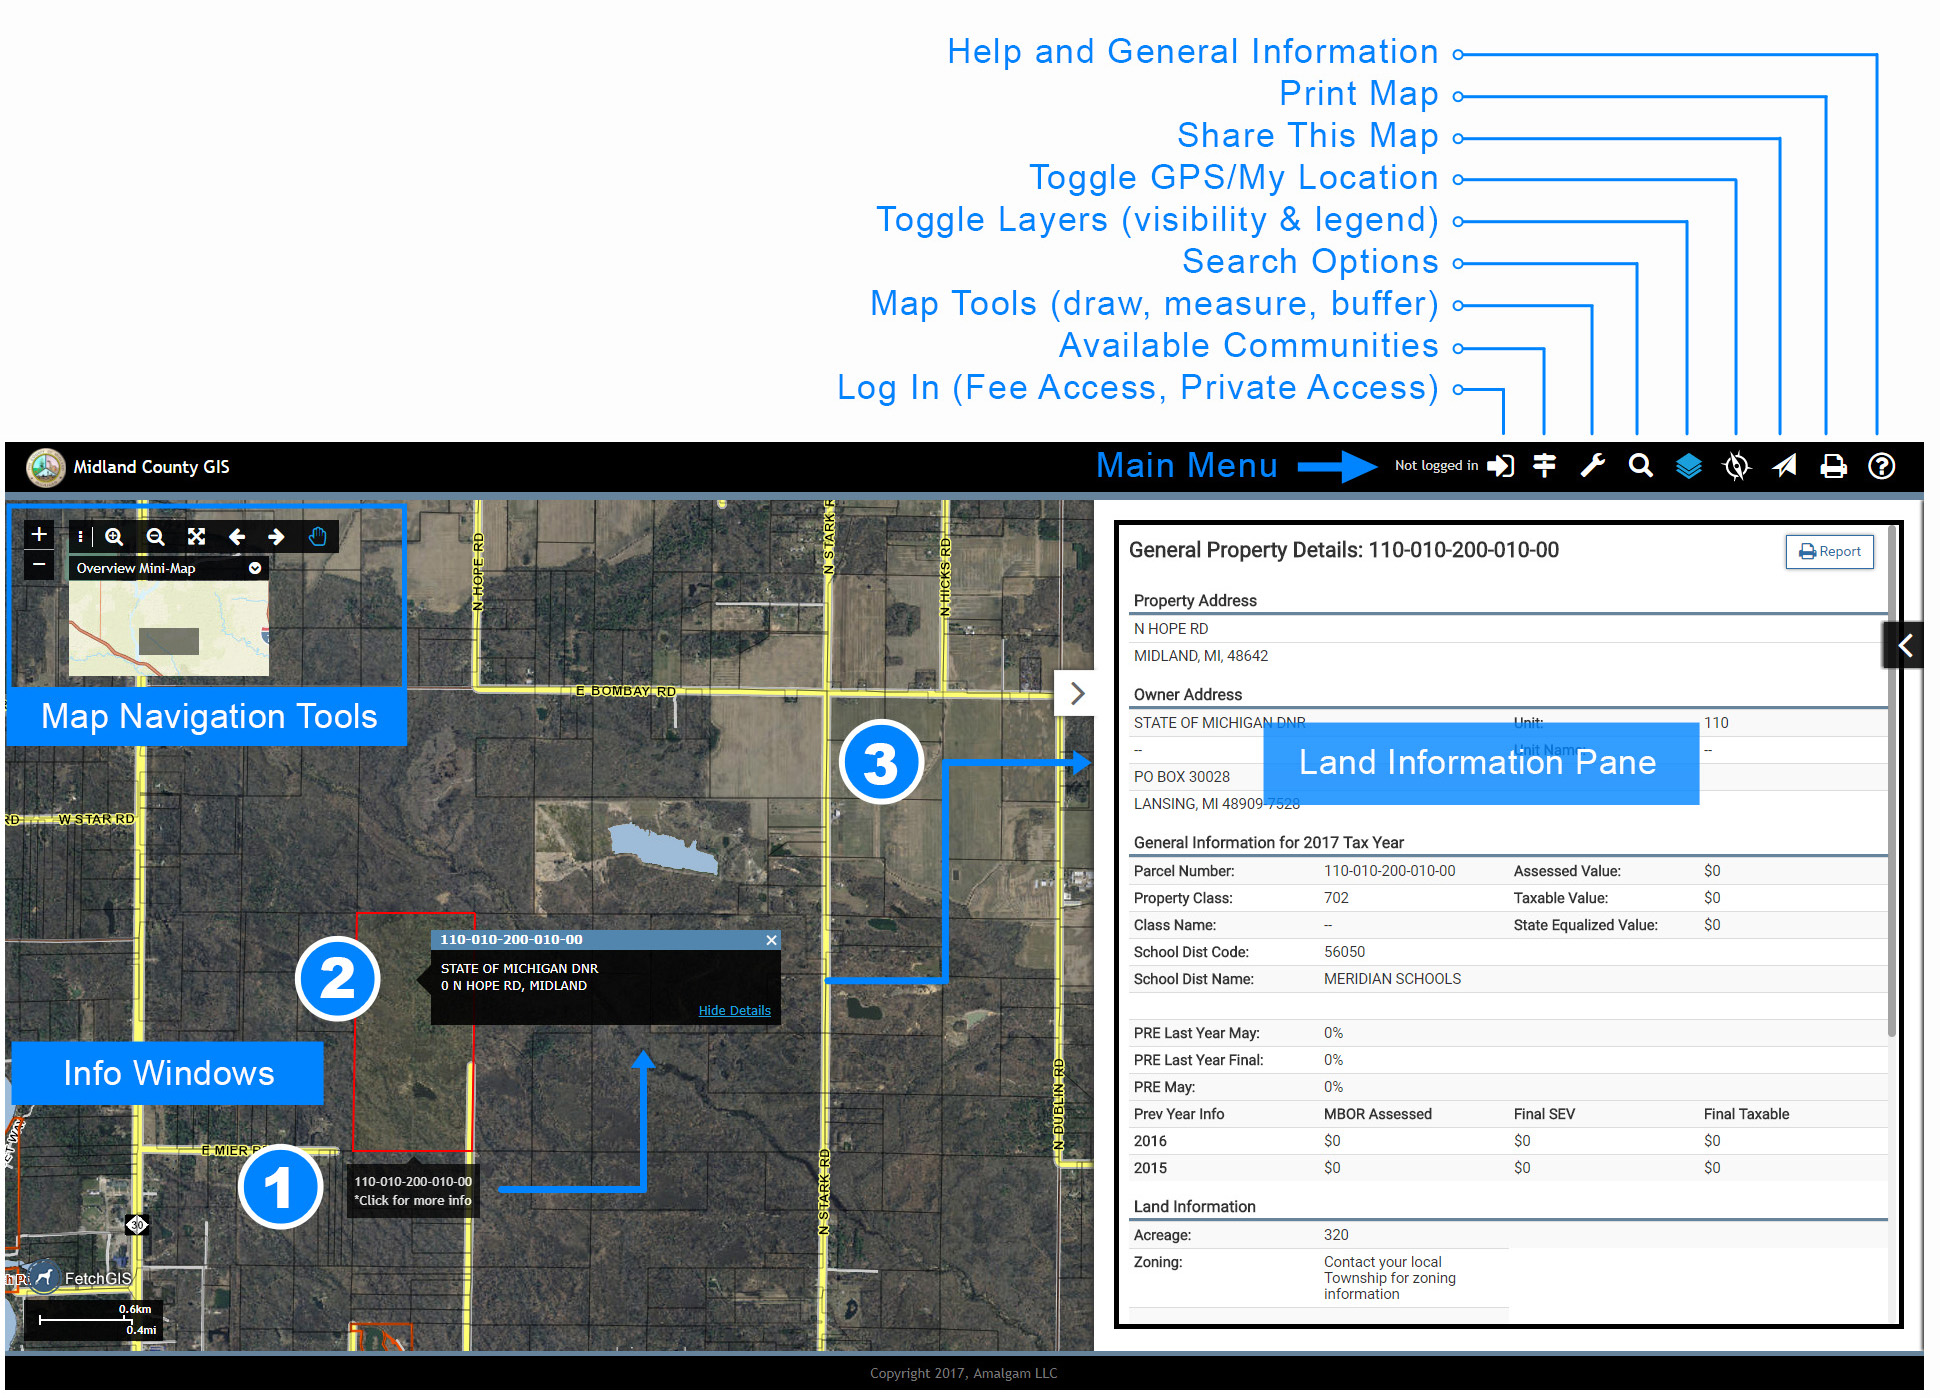
FetchGIS Workspace

Main Menu Bar

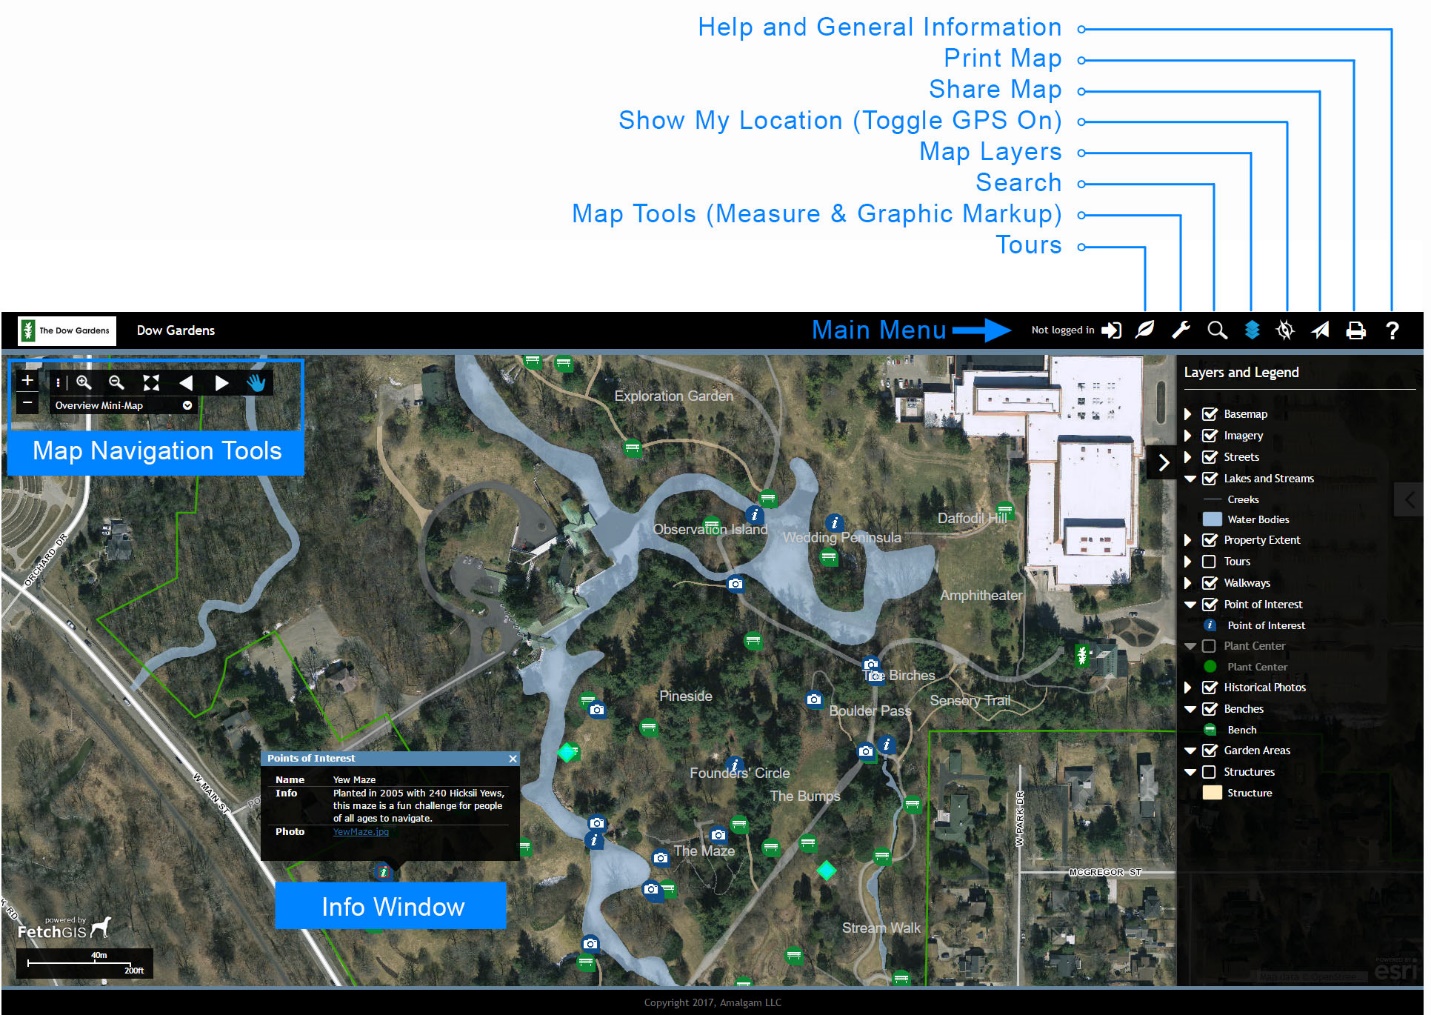
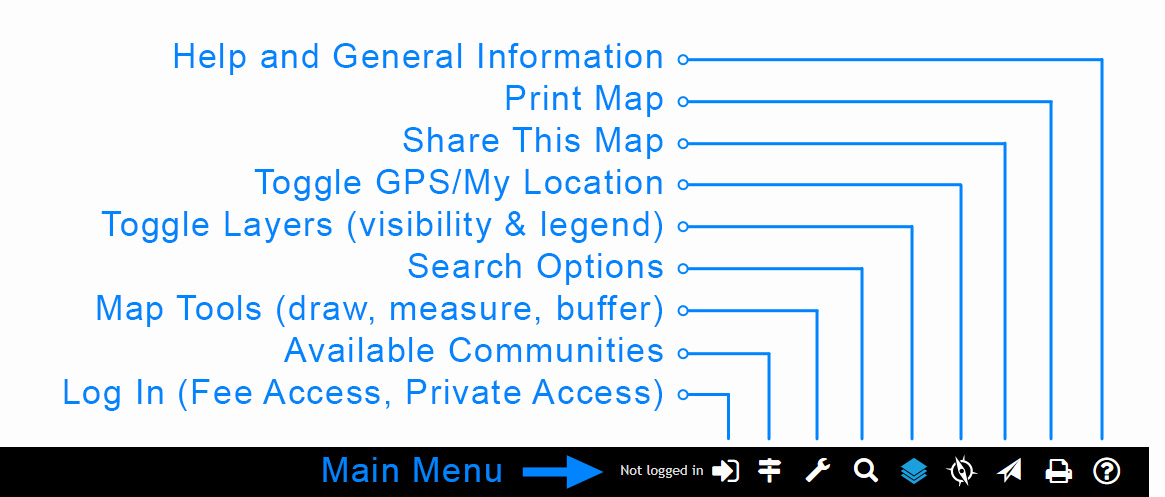
The Main Menu Bar provides access to a number of options including access to Map Tools, Search Options, Printing, Help and displaying a GPS location on the map. These options are described further below.

Log In - Used to access Private Access Services and Fee Access Services.

Change FetchGIS Service - Used to change the current FetchGIS service to another community.

Map Tools - Provides access to a number of tools used to interact with the map display including Draw, Measure, Buffer and more.

Search - Access search options for finding parcels, road intersections and more where available.

Toggle Layers - Displays the Layer Groups and Layers available in the current FetchGIS service. Provides a legend and visibility toggle for Layer Groups and Layers.

Toggle GPS - Displays the current location of a user on the map when GPS is enabled on their mobile device. Note, positional accuracy is determined by the mobile device and not FetchGIS.

Share Map - Creates a tiny URL (link) that can be shared with others. Shared maps preserve the current visible layers, graphic markup on the map and the zoom level or map scale.

Print - Used to open the Printing Pane and create a custom map that can be printed or saved as a PDF.

Help - Used to access FetchGIS Help documentation and General Information.

Main Menu Options

Navigation Tools

Map Navigation tools are located on the Map Navigation tool bar in the top-left corner of the map, which contains six tools used for manipulating map scale and location. This tool bar can be moved around the map by clicking and holding the three vertical dots on the left side of the tool bar and dragging it to a desired location. FetchGIS keeps a navigation (pan/zoom) history so you can step backward and forward through each navigation change.

Navigation Tool Bar

The Map Navigation tools are described below:


Zoom In - Click and drag the mouse over an area, then release to zoom in. The smaller the drawn box, the further the map will zoom in.

Zoom Out - Click and drag the mouse over an area, then release to zoom out. The smaller the drawn box, the further the map will zoom out.

Original Zoom - Returns map to the original view from when the map first loaded.

Zoom/Pan Undo - Steps back through the navigation history.

Zoom/Pan Redo - Steps forward through the navigation history (after one or more pan/zoom Undo action has been performed).

Pan - Click and drag map display to change location.


Incremental Zoom - Zoom controls located just left of the Navigation Toolbar (if available) used to zoom in (+) or zoom out (-) one level.

Overview Map


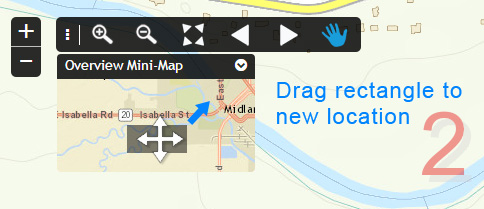
The Overview Mini-Map displays the current map extent (the map visible on the screen) as a rectangle graphic in an Overview Map. The Overview Map can be used to Pan the current map display by placing the cursor over the rectangle graphic and dragging it to a new location in the Overview Map, which will Pan the map display to the match the location in the Overview Map.

Overview Mini-Map

Information Windows


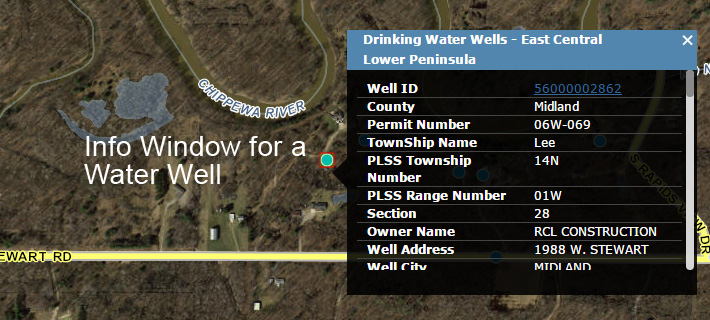
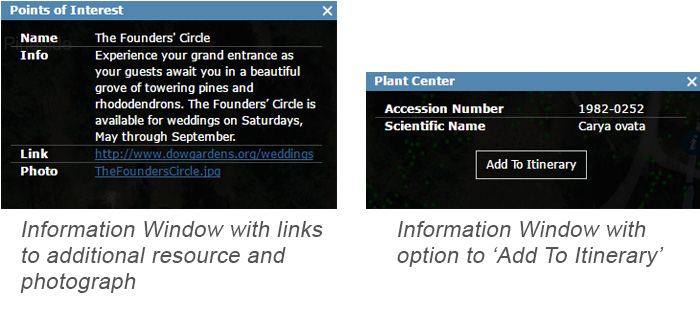
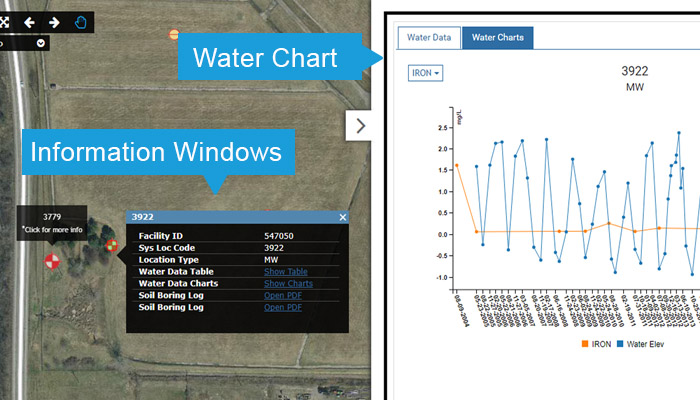
Information Windows or ‘pop-up windows’ are used to display information about a feature, and can show information from a few lines of text, to images, links to external documents, charts, and even small database tables. A feature is a representation of a real-world object on a map. Features can include things such as parcels, parks, trails, soils and more. Many (but not all) features can be clicked or tapped to show an info window.

Information Window

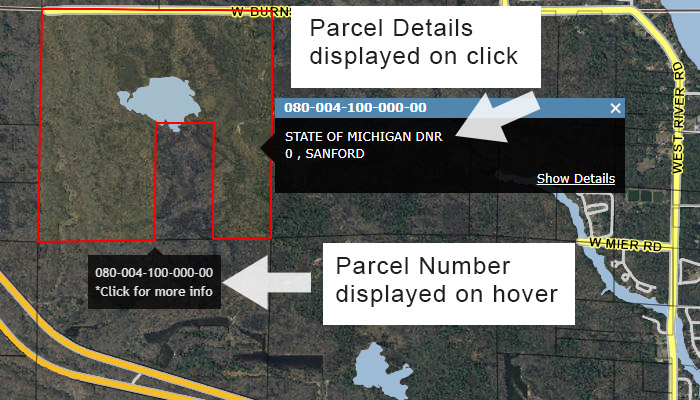
For example, when the parcel layer is visible in the map display, the Pan Tool can be used to view Information Windows containing information about a parcel. Moving the Pan Tool cursor over (hover) a parcel will highlight the parcel and open a small Information Window that displays the Parcel Number and an option to ‘Click for more info’.


In some cases, it"s not feasible to try to display all of the data associated with a feature in an Info Window. In such cases a link will appear at the bottom of the info window that reads ‘Click for more info’. Clicking or tapping on this link text will open a second, larger Information Window with additional information. A great example that is present in most Fetch viewers is the parcel layer. Selecting the ‘Show Details’ option for a parcel will open the Land Information Pane to display the complete parcel record details such as the Property Address, Owner Address, General Information for Current Tax Year, etc.

Important: Map Layers, such as parcels, are displayed based on zoom level. This is often referred to Level of Detail (LOD) and means that a Map Layer may not be visible until the map display is sufficiently zoomed in.

Map Tools

This section describes tools available on the Main Menu bar.

Toggle Layers


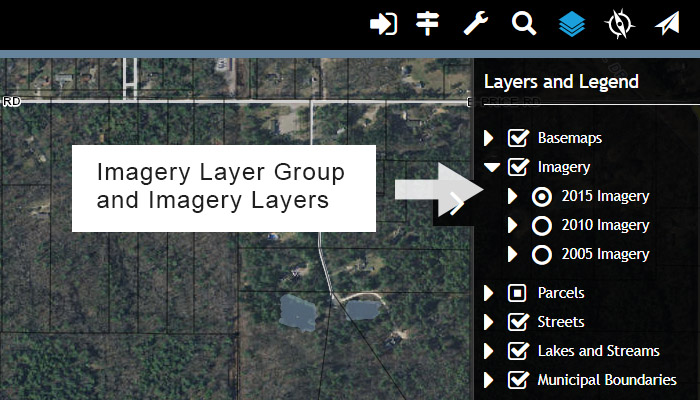
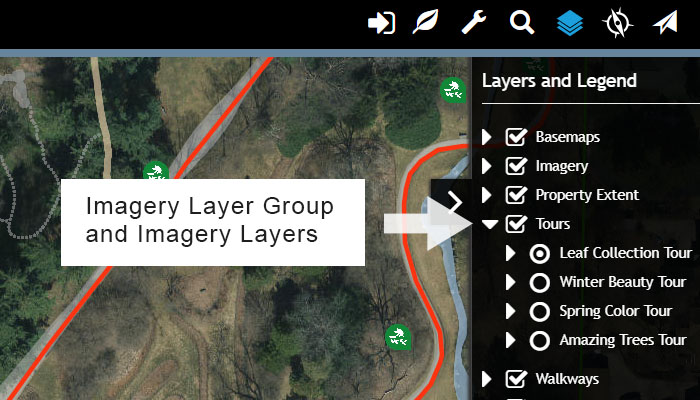
Map Layers can be controlled by selecting the Toggle Layers option on the Main Menu. Map Layers are organized as a Layer Group or as a single Layer. Layer Groups contain more than one Layer, such as Imagery as a Layer Group with multiple years of imagery representing individual Layers in the Layer Group. To view the Layers in a Layer Group click the chevron and the Layers will be listed below the Layer Group as shown below.

Layer Visibility - Map Layer visibility is controlled by toggling on/off the check box displayed to the left of the Layer name. Toggling the visibility on/off for a Layer Group will turn on/off all Layers in the Layer Group.

Layer Symbology - To view the Legend/Symbology for a Layer click the chevron displayed to the left of the check box.

Control Map Layers under Toggle Layers

Search Tool


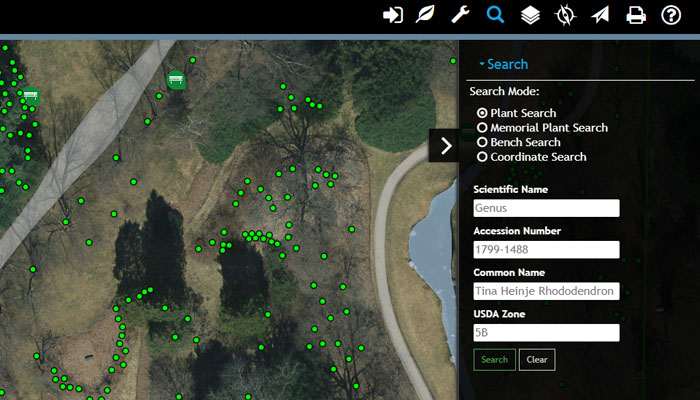
Search Tools provide options to discover information about specific map layers, such as parcels. In general all Search options work by entering a search term(s), like a parcel number or two roads that intersect, and then selecting Search or pressing Enter on the keyboard.

Parcel Search

Enter a Parcel Number, Owner Name or Street Address to find a parcel, and then select Search. The results of the Search are displayed under the Search Results, where a list of matching parcels is displayed along with a blue Map It icon.

Selecting the Map It icon will zoom the map display to the selected parcel, while selecting the parcel information will open the Land Information Pane to display parcel record details (if available).

The Recently Viewed option, located at the bottom of the Search menu, provides a history of the parcels that have been searched during a session. Similar to the Search Results, selecting the Map icon will zoom the map display to the selected parcel, while selecting the parcel information will open the Land Information Pane to display parcel record details (if available).

Using the Parcel Number provides the most direct method to find a parcel. The Parcel Number input boxes will accept a partial Parcel Number and return matching results.

Search Results

Road Intersection


Enter the names of two roads to find a road intersection. When a road intersection match is made the map will zoom to the location of the corresponding intersection and display an Information Window with the names of the two roads. If the Search results in no match an error message will appear.

Coordinate Search


Enter coordinate values to find a location in the map. When a pair of coordinates in decimal degrees (-83.902, 43.580) is entered the map will zoom to the location of the corresponding point and display an Information Window with the coordinates of the point. If the Search results in no match or if the location is outside the map extents an error message will appear.

Drawing Tools


The Drawing Tools allow users to place a graphic element on the map display. Select a graphic element from the Drawing Tools menu to draw graphic elements on the map display. Depending on the graphic element that is drawn, a number of customization options are provide to modify the fill color, fill opacity, line color, line width, point type, point size and a font options.
All graphic elements can also be edited to modify the shape of the graphic, add vertices, rotate the graphic and for text graphics modify the text and font attributes (see Advanced Graphic Operations at the end of Drawing Tools to learn more about editing graphic elements).

Graphic elements are retained when using the Share This Map option on the Main Menu. For example, if a rectangle is drawn on a map that is shared, it will be displayed when others view the map from a Share Map link.

Point Tool - To create a Point graphic activate the Point Tool, select the desired color, point size and point style, and then click on a desired location in the map display to add the Point graphic.

Line Tool - To create a Line graphic activate the Line Tool, select the desired color and line width, and then click and hold down the mouse button while dragging the cursor on the map display to start the Line graphic. Releasing the mouse button will terminate the drawing and place the Line graphic on the map display.
Polyline Tool - Polylines and Polygons are unique graphic elements that can be created using manual interaction with the map display, or by using coordinate geometry (COGO) to enter, for example a metes and bounds description (see Coordinate Geometry below for instructions regarding drawing Polyline or Polygons using coordinate geometry).

To manually create a Polyline graphic activate the Polyline Tool, select the desired color and line width, and then click on the map to start drawing the Polyline. Additional vertices can be added along a Polyline by clicking the map. To finish a Polyline double click the last vertex and the Polyline graphic will be placed on the map display.

Polygon Tool - To manually create a Polygon graphic activate the Polygon Tool, select the desired fill color, line color and outline width, and then click on the map to start drawing the Polygon. Additional vertices can be added along a Polygon by clicking the map. To finish a Polygon double click the last vertex and the Polygon graphic will be placed on the map display (see Coordinate Geometry below for instructions regarding drawing Polyline or Polygons using coordinate geometry).

Rectangle Tool - To create a Rectangle graphic activate the Rectangle Tool, select the desired color and line width, and then click and hold down the mouse button while dragging the cursor on the map display to start the Rectangle graphic. Releasing the mouse button will terminate the drawing and place the Rectangle graphic on the map display.

Freehand Polyline Tool - To create a Freehand Polyline graphic activate the Freehand Polyline Tool, select the desired color and line width, and then click and hold down the mouse button while dragging the cursor on the map display to draw the Freehand Polyline. Releasing the mouse button will terminate the drawing and place the Freehand Polyline graphic on the map display.

Freehand Polygon Tool - To create a Freehand Polygon graphic activate the Freehand Polygon Tool, select the desired fil color, line color and outline width, and then click and hold down the mouse button while dragging the cursor on the map display to draw the Freehand Polygon. Releasing the mouse button will terminate the drawing and place the Freehand Polygon graphic on the map display.

Add Text - To Add Text activate the Add Text Tool, enter some text, select a font color, font size, font style and font type, and then click the location on the map to place the Text on the map display.

Editing Graphics


Select a Graphic - To start editing a graphic element on the map display the graphic must first be selected. Use the Select button located under the 'Editing Options' in the Drawing Tools menu to select a graphic element to edit.

The appearance of a graphic element will change once it is selected and a number of editing options will become available to modify the graphic.

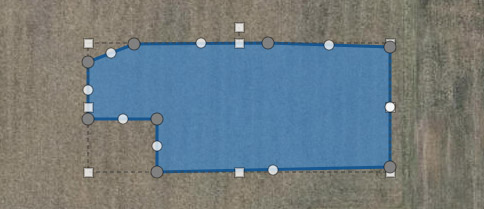
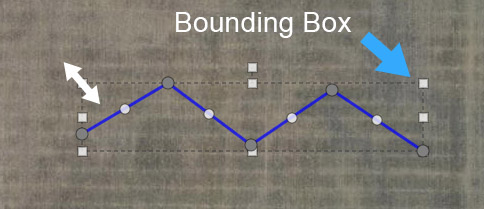
For most graphic elements, when they are selected a ‘bounding box’ will appear around the graphic as displayed in the image below. The bounding box is used to perform various edits discussed in the next section.


Bounding Box for a selected Polygon graphic

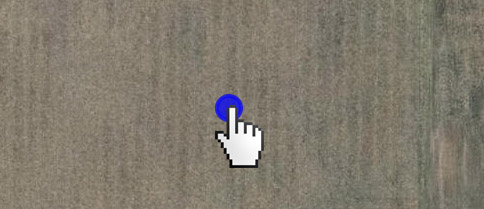
Two exceptions to how a selected graphic element appears is the Point and Text graphics. Because a Point can only be moved, a bounding box is not displayed around the Point graphic when it is selected. However, moving the mouse cursor over the Point will change the cursor as displayed below.

Cursor appearance when over a Selected Point

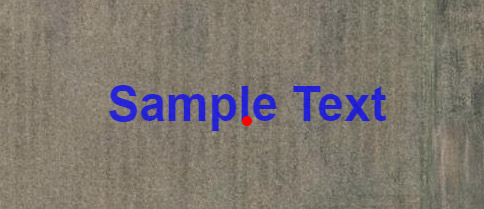
Selected Text graphics will appear as displayed below with a red point in the bottom center of the text

Selected Text

Editing Options


Editing graphic elements using Move, Scale, Rotate and Vertices are described below. Note that to perform an Edit, the graphic must be selected.

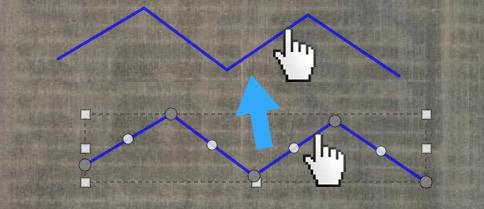
Move - Position the mouse cursor on a graphic element (cursor will change to the Hand cursor) and then drag the graphic element to a new location on the map display (see image below).

Important: Graphics, such a Polygons and Polylines, also rely on the Hand cursor to add or move vertices. In order to move one of these graphics, be sure that the Hand cursor is not coincident with a vertex..

Moving a Graphic Element

Scale - Position the cursor on any of the eight bounding boxes (cursor will change to a Double Arrow cursor) that appear around a graphic element and drag the box to scale the graphic. (see image below).

Drag a Graphic Elements bounding box to Scale

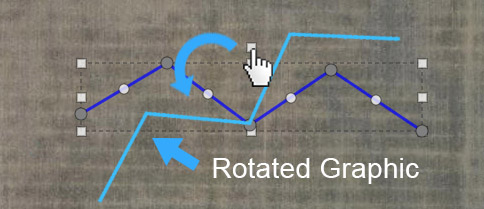
Rotate - Position the mouse cursor on the white control box located at the top of the graphic element and drag the cursor (cursor will change from the Hand cursor to the Plus cursor) to the right or left to rotate the graphic element (see images below). (see image below).

Using the Control Box to Rotate a Graphic Element

Edit Vertices - Vertices can be added or moved for Polylines, Polygons and Free Form graphic elements and are display in two colors when the graphic element is selected.

Gray Vertex - A gray vertex represents a vertex that is active in the graphic element, it can be moved by positioning the cursor over an active vertex and dragging it to a new location.

White Vertex - White vertices appear between all active (gray) vertices on a graphic element. They are used to add a new vertex to a graphic element. Position the cursor over a new vertex and drag it to a new location, resulting in a new active vertex on the graphic element.

Reshaping a Graphic Element

Coordinate Geometry (COGO)


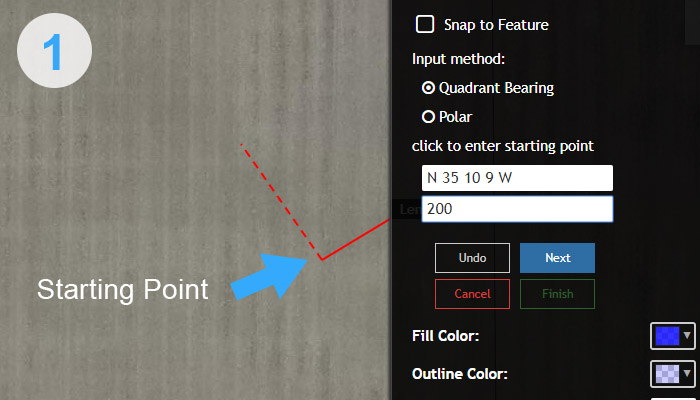
Drawing a Polyline or Polygon graphic element can be drawn on the map display using general COGO. Angle measures can be entered as Polar (0 – South, 90 – East, 180 – North, 270 – West) or Quadrant Bearing (N DD MM SS W – for example N 20 15 10 W).

The following is a description of how to use the COGO tools to draw a Polyline or Polygon graphic element.

Select Units and Input Method - The COGO process uses a distance and direction, so the measure Units and Input Method need to be selected. By default Units are feet and the Input Method is Quadrant Bearing.

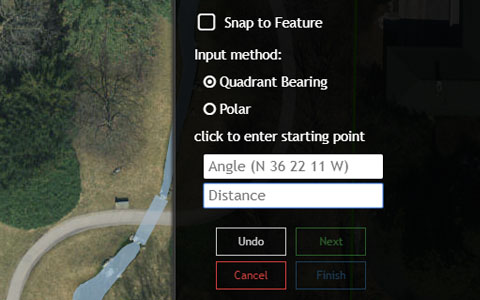
Select a Starting Point - Click the location on the map display that will be the first point in the COGO drawing. Once the first point is placed the COGO menu display two input boxes (see image below) for entering the direction and the distance for additional measures.

Enter an Angle and Distance to draw Graphic Element

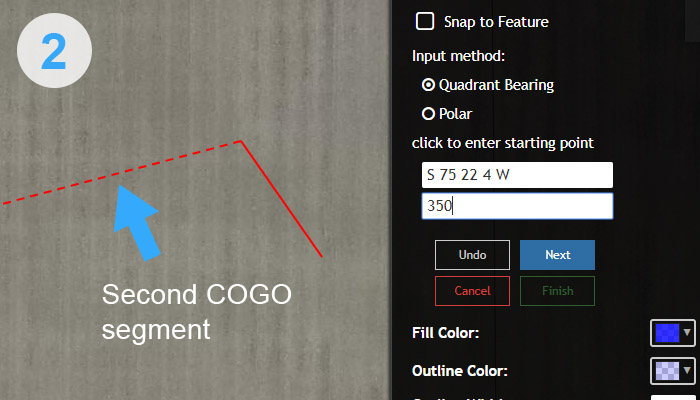
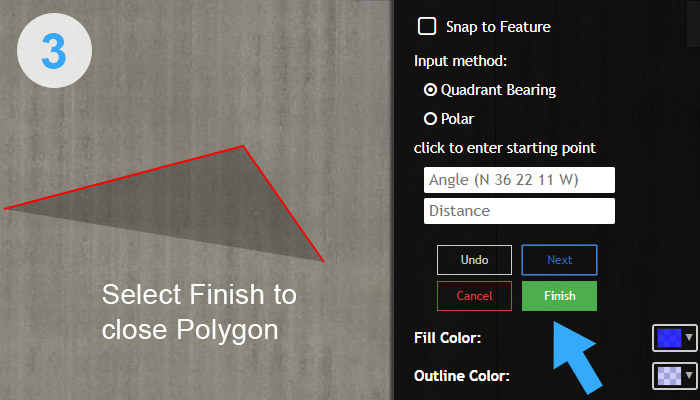
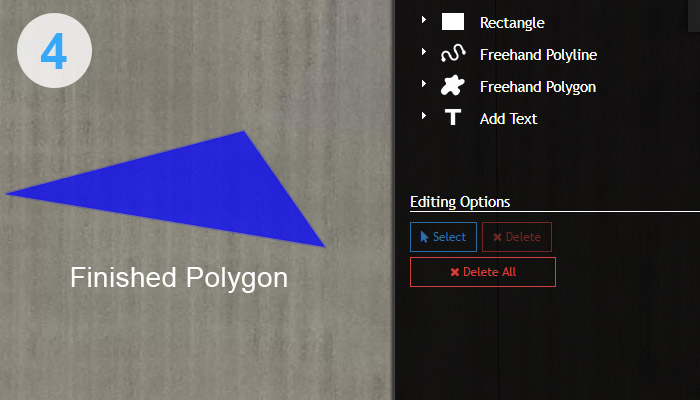
Adding Line Segments - Use the input boxes to enter a direction and distance for subsequent measures as displayed below. When the graphic element is complete select Finish to end the COGO process and close Polygon graphic elements.

Important: For direction, the measure must be entered as displayed in the input box.

Measure Tools


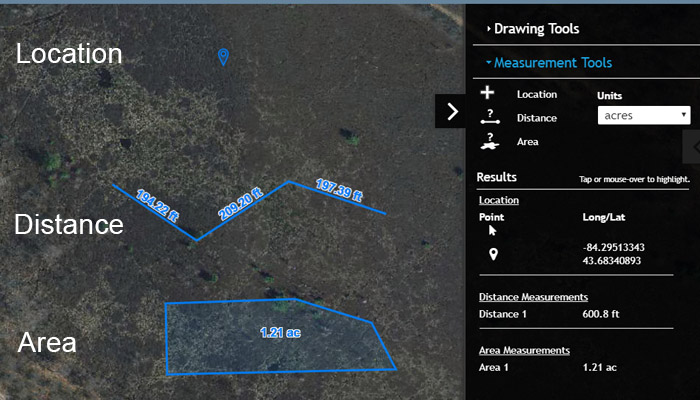
Measure Tools enable users to identify the X and Y position of a location, make linear (distance) measures and area measures. Each Measure Tool provides options to change the units, for example for Linear Measures units can be set to Feet, Yards, Miles, Meters and Kilometers.

Location - The Location measure is used to identify the X and Y coordinates of a location on the map display. Move the cursor to the desired location and click to obtain the coordinates, which are displayed in the Tool Window. The Location measure can be used to identify the coordinates of multiple points.

Distance - Measures the linear distance between two or more points on the map display. Move the cursor to the desired start location and click and then move the cursor to the next location and click again. Any number of successive measures can be made and to complete the Distance measure double click at the termination point. The Total Length of all measure segments is displayed in the Tool Window.

Area - Measure the area formed by three or more linear measures. Area measures are made using the same process as measuring a Distance. The total Area of a measure is displayed in the Tool Window.

Measures can be removed from the map display using either the Delete or Clear All options. Clear All will remove all measures from the map display. To remove a single measure use the Select option to select a measure, and then select Delete.

Examples of Measurement Types

Buffer Tools


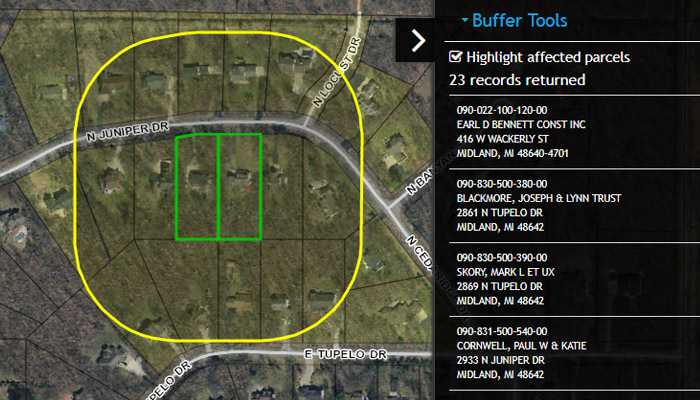
The Buffer Tools provide options for selecting parcels based on their distance from a parcel(s) or graphic(s) that is selected. The Buffer Tool is commonly used to created notification lists for a variety of use cases, so Buffer Results can be exported to CSV or printed as labels directly from FetchGIS.

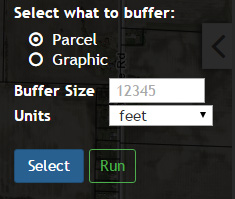
Select Target - The Target is a parcel(s) or previously placed graphic element(s) that will be used to run the Buffer against. For example, if a Buffer Size of 300 feet is used, all parcels within 300’ of the Target parcel(s), or graphic element(s) will be selected. The Buffer Size extends from the outer edge of a parcel(s) or graphic element(s).

Create a Buffer using a Parcel or Graphic

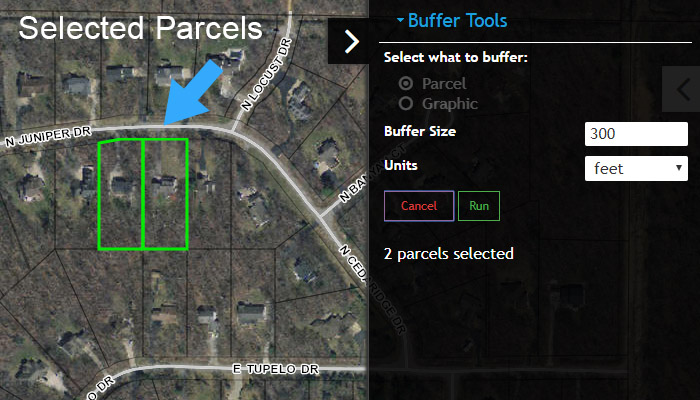
To select a parcel(s) or graphic element(s) select the Select option from the menu and click on the desired parcel(s) or graphic elements to use for the Buffer. To deselect a parcel(s) or graphic element(s) click on the selected feature.

Multiple Parcels selected for Buffer Target

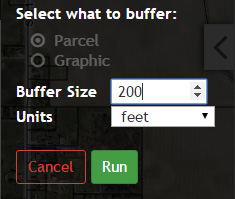
Execute Buffer - Once the Target parcel(s) or graphic elements(s) are selected use the Buffer Size input box to enter a Buffer distance and select the desired units. The Buffer distance represents the distance from the Target that will be used to select additional parcels.

Select Run from the menu and parcels that fall within the Buffer distance will be highlighted on the map display and added to the Buffer results as displayed below.

Enter Buffer Size
Buffer Results

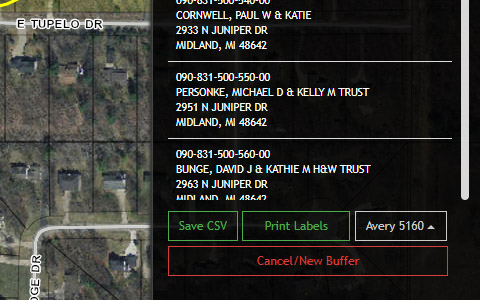
Buffer Results - Buffer results can be printed as labels or exported to a comma delimited file (CSV) for use with custom mail merge routines and labels. Use the menu displayed at the Bottom of the Buffer Tools window to save a CSV, Create Labels or clear the Buffer Results.

Parcels listed in the Buffer Results can also be selected to view detailed land information for the corresponding parcel. Simply click on the desired result to zoom the map to that parcel.

Save Results as CSV or Print Labels

GPS


Using GPS may assist in establishing a location in the field when other identifiable benchmarks can't be located using standard imagery available in the application. GPS accuracy will vary depending on several variables including the GPS technology and impacts from the field such as proximity to buildings, canopies or other features that obstruct a clear satellite signal.

GPS Technology


Internal GPS - available on most smartphones and tablets that can work with a cellular data plan. While there may be exceptions to this rule, in general internal GPS, on a tablet for example, will be less accurate than an external GPS unit. Just to note, tablets that lack the capability of receiving cellular data (3G or 4G LTE for example) will try to use WiFi access points to get a rough approximation of location.

External GPS - external GPS units are used in conjunction with a smartphone or tablet to provide improved accuracy. External GPS units communicate to a tablet using Bluetooth and may require a second application from the GPS vendor

Enable GPS Location


In order to view your location on the map using GPS select the 'Toggle GPS/Location Marker' button from the Main Menu.


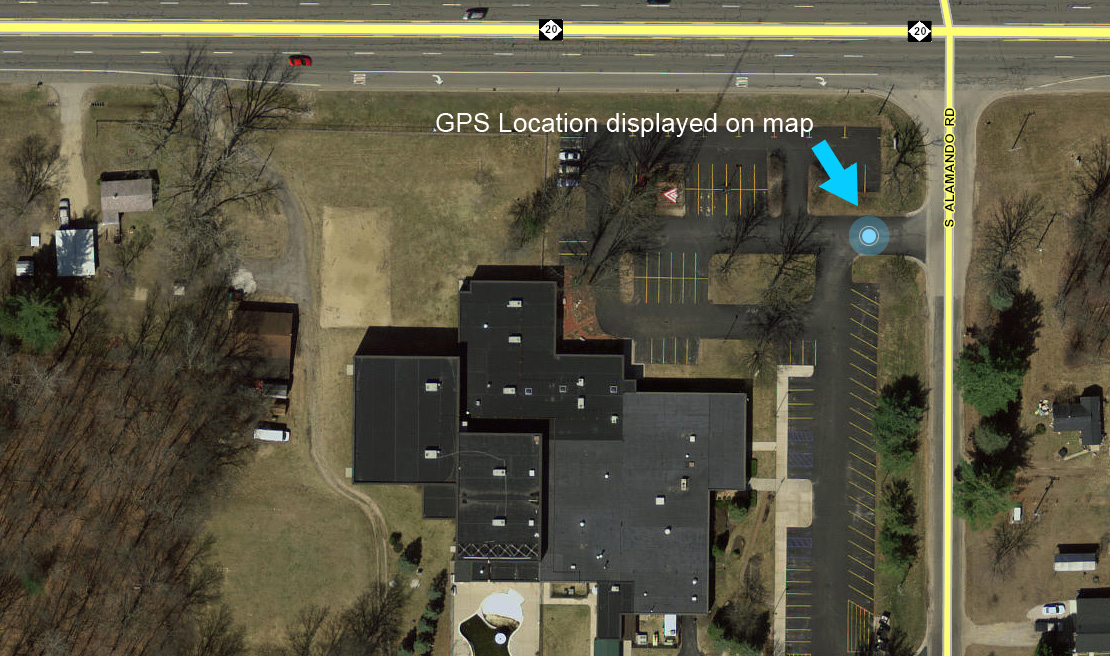
Once the GPS is enabled you should see your location on the map as a standard 'blue dot' marker as shown below.


Printing Maps & Parcel Reports


Custom Maps and Parcel Reports are used to generate hardcopy or digital output. For both options, digital output is provided as an Adobe PDF. Users accessing Map output and Parcel Reports from a FetchGIS Fee Access service are required to remit a fee prior to generating output.

Printing Maps


To create a Map, select the Print option from the main menu. This will open a preview of a Map and present menu options to customize the Map. The Map displayed in the preview is interactive and can be repositioned using the Navigation Tools located at the bottom of the Print Pane. Any Information Windows can also be closed to remove them from the final print.

The following options can be modified for a Map:

Title - Enter a new Map Title in the input box.

Subtitle - Add a Subtitle by entering text in the Subtitle input box.

Paper Size - Select between Letter and Legal for paper size.

Paper Orientation - Select Landscape or Portrait.

North Arrow - Select a North Arrow to be used in the Map.

To create a final Map select the Generate PDF option from the Print menu and a PDF will be generated that can be Saved or Printed.

Parcel Reports


Parcel Reports are created from the Land Information Pane, which is accessed by clicking a parcel and selecting 'Show Details'. In the Land Information Pane select Generate Report and a Parcel Report preview will be displayed.

Similar to Printing Maps, the Map displayed in the Parcel Report preview is interactive and can be repositioned using the Incremental Zoom and Pan Tool. The Tax History (where available) and the Map can be removed from the Parcel Report by toggling on/off the corresponding check boxes in the menu. To create a final output select either Print or Generate PDF as described below.

Print - Selecting Print will open a default printer for printing the Parcel Report.

Generate PDF - Selecting Generate PDF will result in a Parcel Report PDF that can be Saved or Printed.

About FetchGIS

The FetchGIS Service was developed by Amalgam LLC. FetchGIS is Amalgam’s web and mobile GIS platform and is used by government, business, industry and non-profits to improve access to geospatial data and information. Amalgam designed FetchGIS to enable efficient paths to commonly requested information and to foster a user experience that is engaging to users that are not familiar with traditional GIS software applications. For advanced geospatial use cases, Amalgam provides additional components, such as private data and field tools, in addition to customization services rendered by an experienced development team.

Founded in 2005, Amalgam provides a full complement of GIS services to government, business, industry and non-profit clients. To learn more about Amalgam, its services and FetchGIS Service options, contact a company representative using the contact information provided below.


809 East Bennett Street
Mt. Pleasant, MI 48858
Office: (989) 772-8981
www.amalgamonline.com