User Guide & Video Tutorials
Map Basics
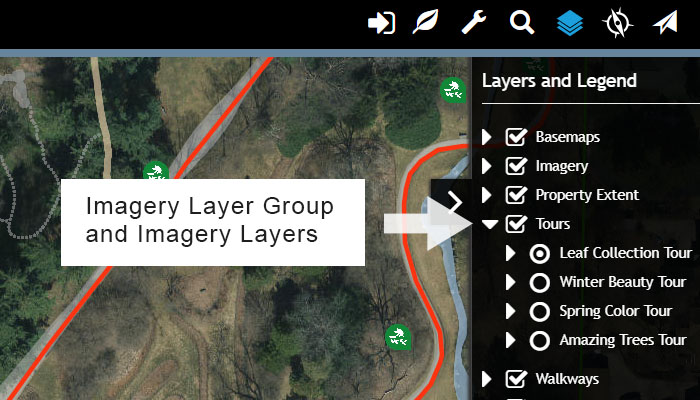
This section covers options for Navigating the map, using Information Windows, managing the visibility of Map Layers and an overview of the
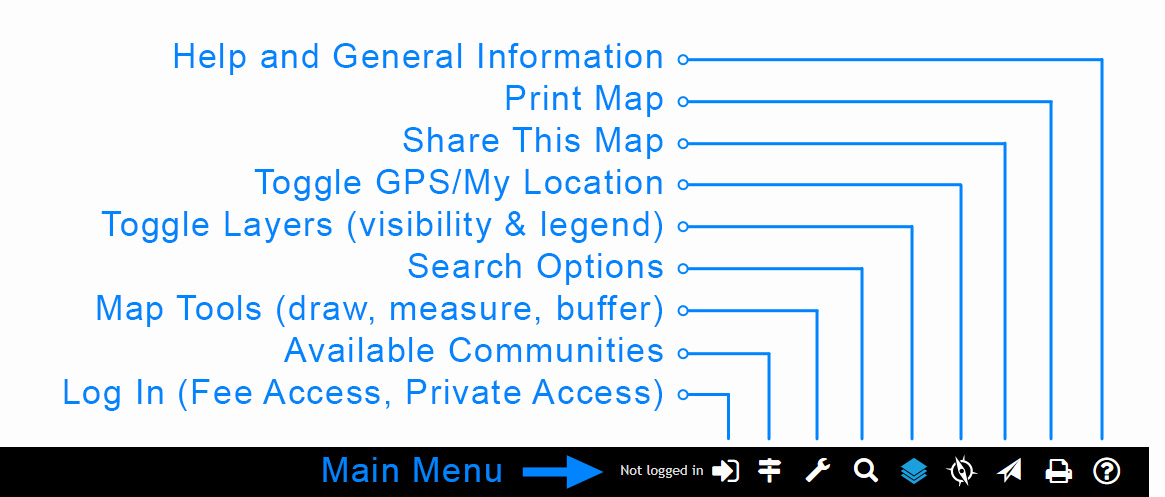
Main Menu Bar options.
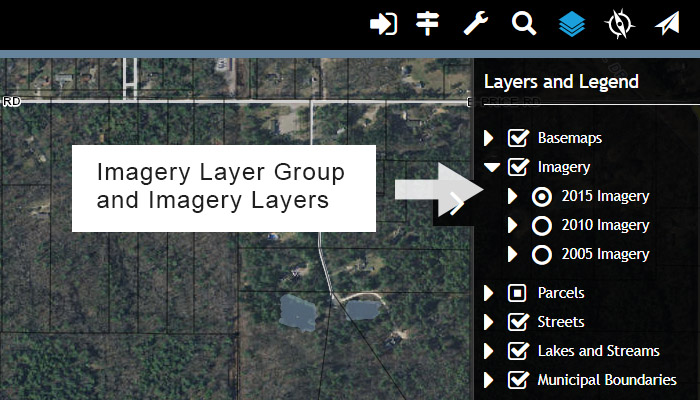
Important: Map Layers, such as parcels, are displayed based on zoom level. This is often referred to Level of
Detail (LOD) and means that a Map Layer may not be visible until the map display is sufficiently zoomed in.
This section covers options for Navigating the map, using Information Windows, managing the visibility of Map Layers and an overview of the
Main Menu Bar options.
Important: Map Layers, such as parcels, are displayed based on zoom level. This is often referred to Level of
Detail (LOD) and means that a Map Layer may not be visible until the map display is sufficiently zoomed in.
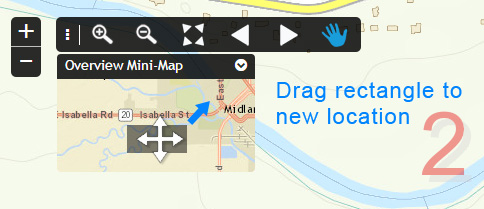
Map Navigation
Map Navigation is the process of changing the map scale or location by Zooming In/Out or Panning the map display. Map navigation is conducted by navigation tools located on the Navigation Toolbar, overview mini-map, incremental zoom buttons, or by using the mouse, touchpad, or touchscreen display. Note: Due to screen size constraints, the Navigation Toolbar and overview mini-map are not available on phones.
The mouse scroll wheel can be used to Zoom In or Zoom Out as described below, or equivalently pinch zooming on touchpads and touchscreens. A double click/tap on the map display will also Zoom In one level, but only when the Pan tool is active.
Zoom - To zoom in, move the mouse scroll wheel up (towards the top of the mouse). To zoom out, move the mouse scroll wheel down (towards the bottom of the mouse). Alternately, touchpads/touchscreens can zoom in by moving two fingers apart, or zoom out by moving two fingers together.
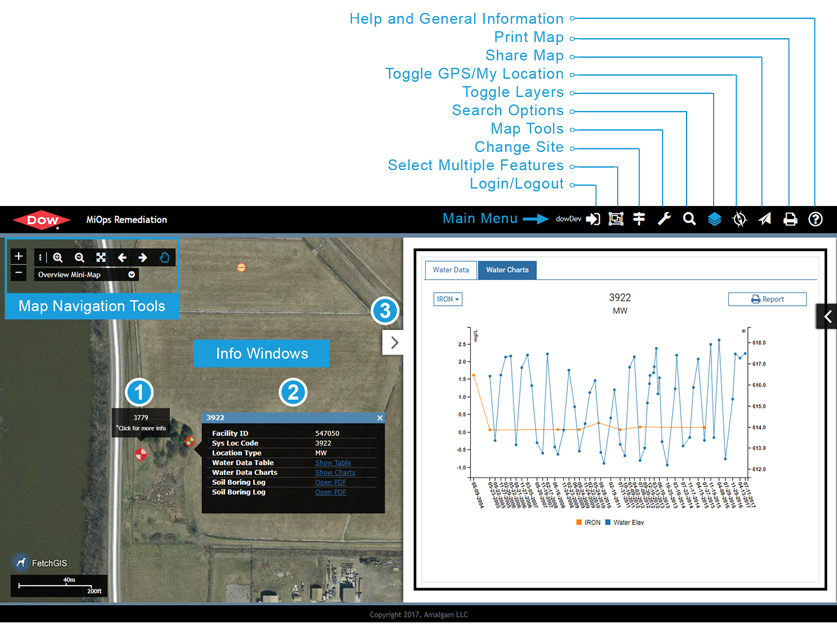
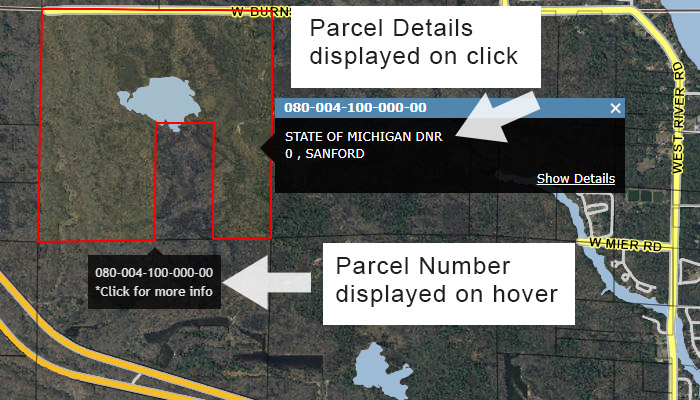
Viewing Information Windows to access parcel information:
-
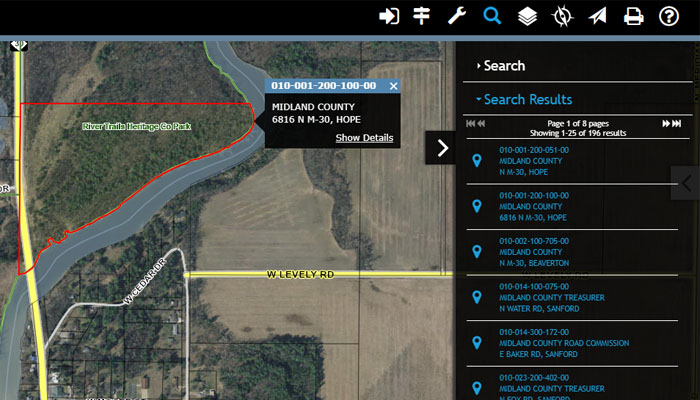
Move the cursor over a parcel to view an Information Window containing the Parcel Number and an option to ‘Click for more info’ (see the number one (1) in the FetchGIS Workspace image).
-
Selecting ‘Click for more info’ opens another Information Window containing additional parcel information, such as the Owner Name and Address, along with the option to ‘Show Details’ (see the number two (2) in the FetchGIS Workspace image).
-
Selecting ‘Show Details’ opens the Land Information Pane to display parcel record details for the selected parcel. The Land Information Pane provides the option to create a Parcel Report that includes a map of the parcel and the parcel record details (see the number three (3) in the FetchGIS Workspace image).
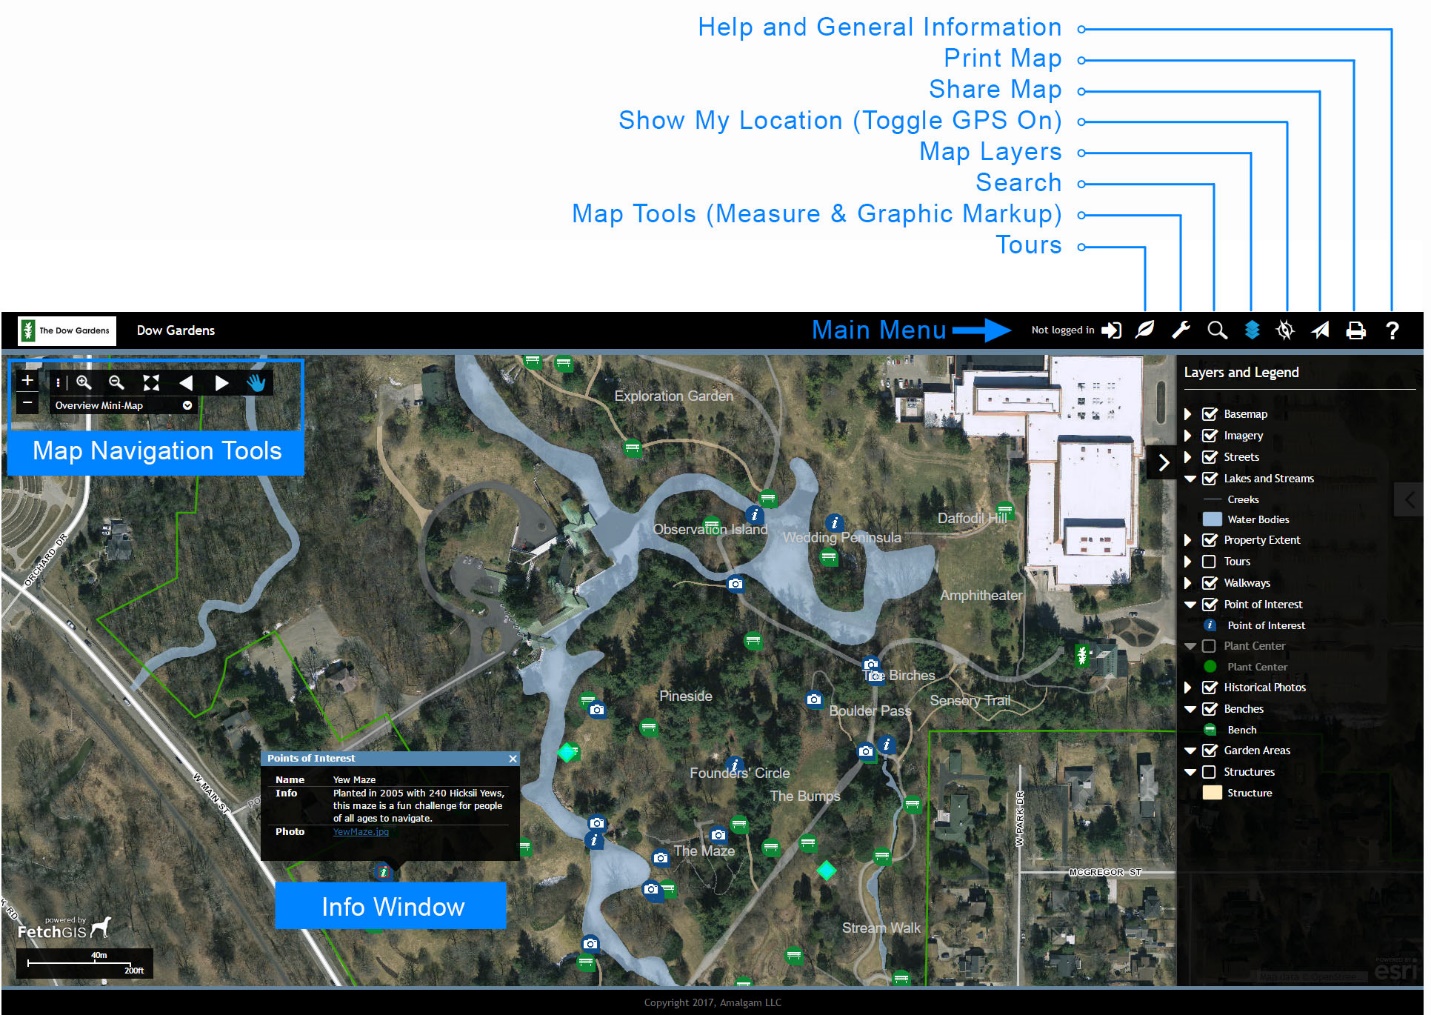
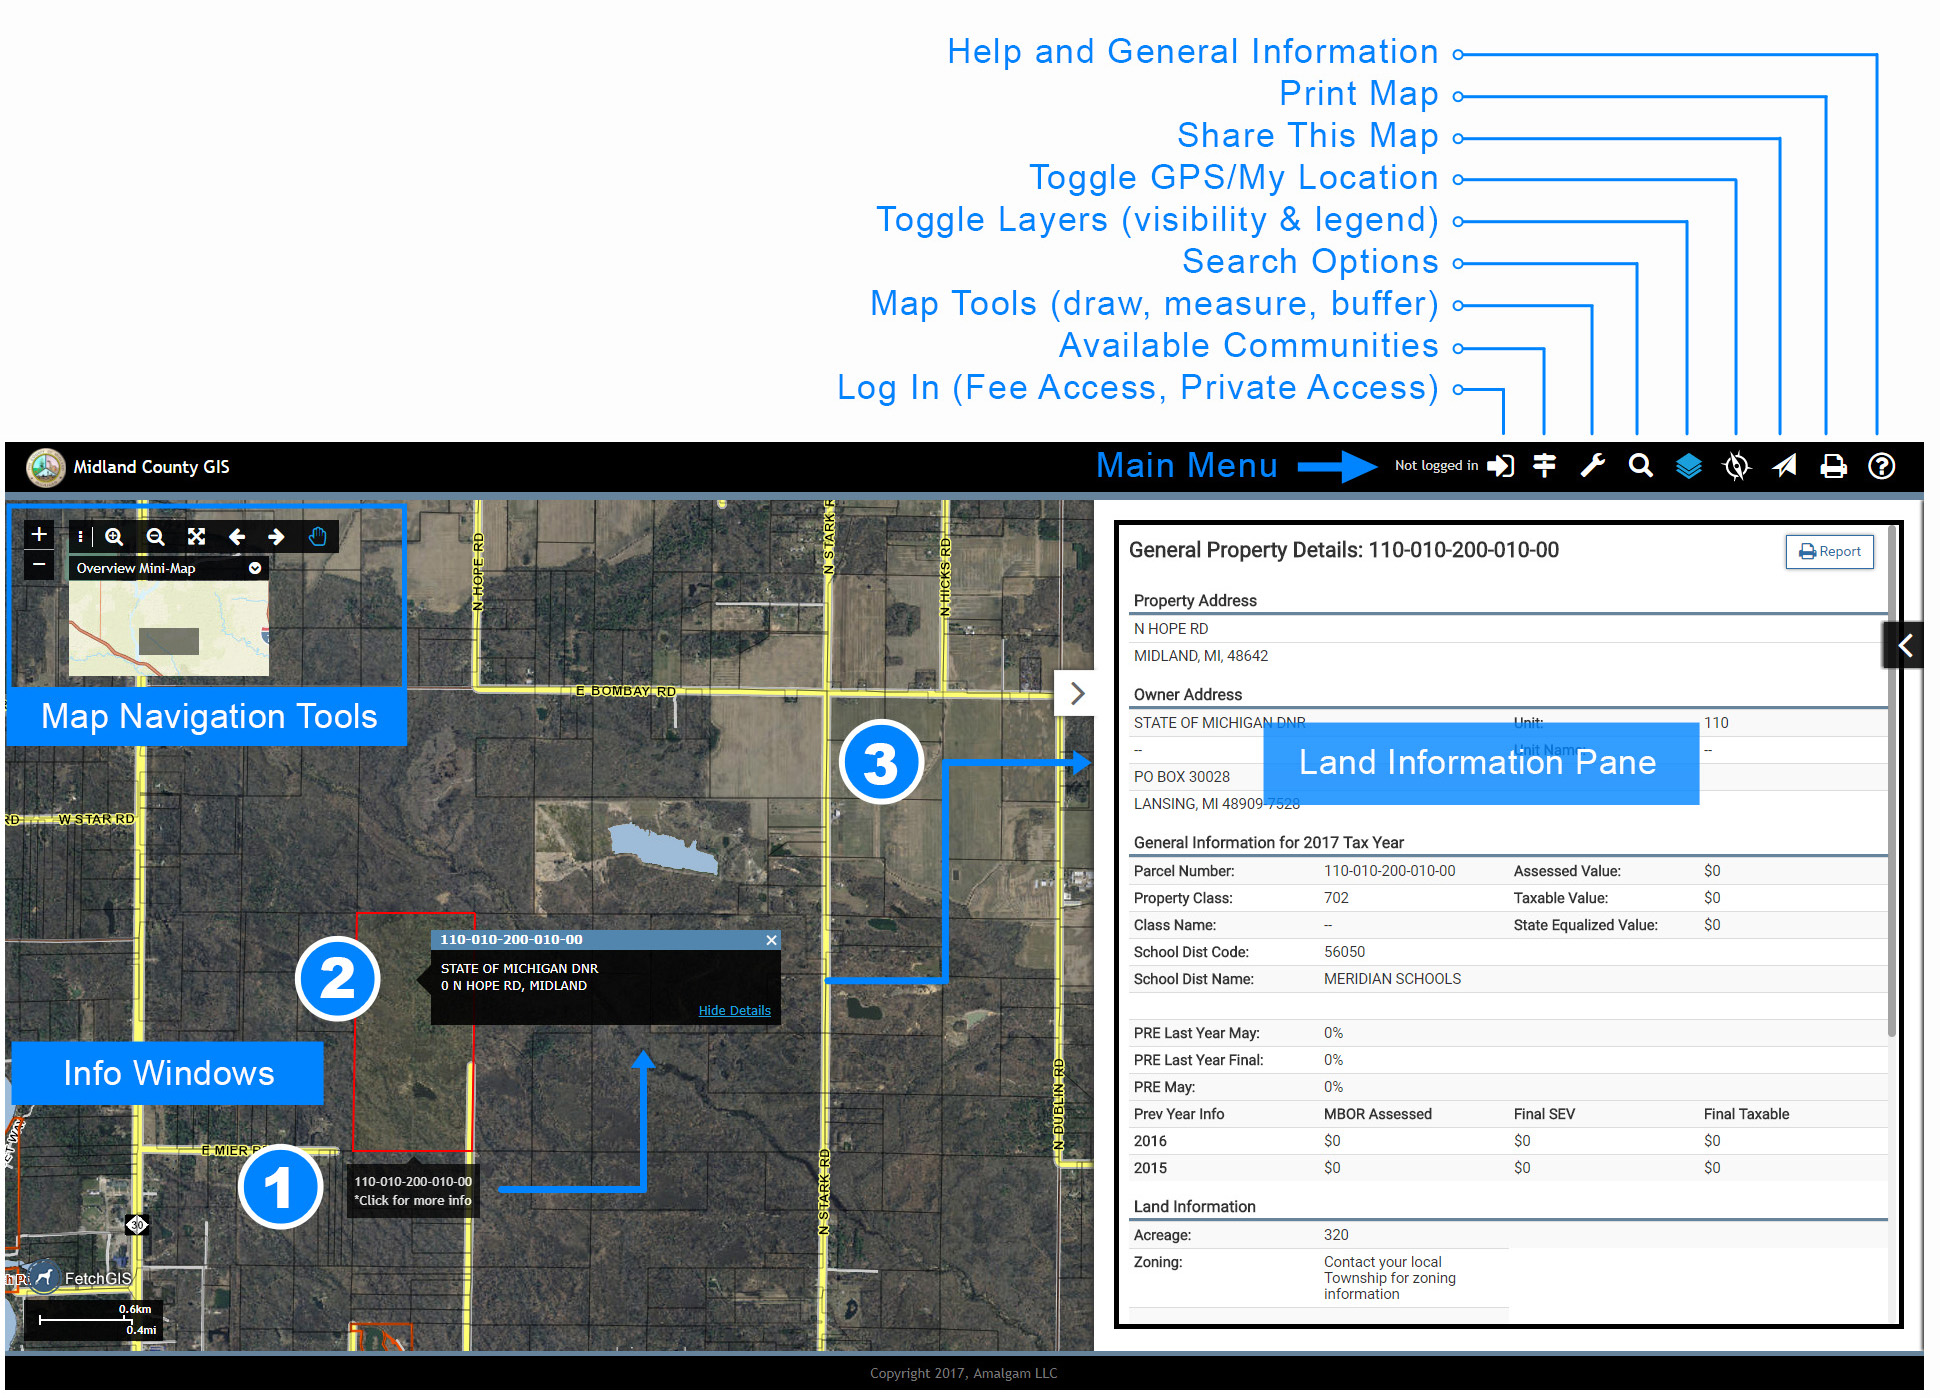 FetchGIS Workspace